ORBIT
Indicator library

Order flow and chart indicators, rebuilt.

Every indicator on ORBIT's charts, in six groups: the classic studies, ORBIT's own session levels, and an order-flow set read from your own Rithmic data. Add any of them as many times as you like, each with its own settings, from the Indicators button on every chart.

Every picture below is a real screenshot of ORBIT's chart drawing that indicator with its default settings or close to them. The prices are generated sample data shaped like an NQ session, not a market recording, so the pictures show how each indicator looks and nothing about how any market will move.
Featured · Order flowOn the price

Big trades

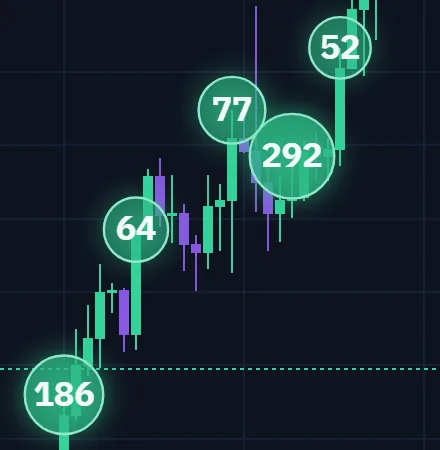
Every large print, as a glowing bubble at the exact price it traded, on the bar that holds it. The number is the contracts; mint means a buyer lifted the offer, violet means a seller hit the bid. Here it is set the way our own desk runs it: smallest print 40 contracts, glow at 30 px.

Close-up of glowing Big trades bubbles of 64, 77, 292 and 52 contracts along the breakout
Close-up: the prints along the breakout.
Settings and details ↓


Trend & averagesOn the price

SMA

Simple moving average

The plain average of the last N closes, drawn as one line through the candles.

Main settings
  • Length (20)
  • Source: close, open, high, low, or an average of them

On the chart: A single line on the price. Add it as many times as you like; shown here as a 20 and a 50.

Trend & averagesOn the priceBOTLAB block

EMA

Exponential moving average

An average that weights recent bars more, so it turns sooner than an SMA of the same length. It starts from the plain average of the first N bars, so it draws nothing until N bars are loaded.

Main settings
  • Length (9)
  • Source

On the chart: A line on the price; shown here as a 9 and a 21 on the same chart.

Trend & averagesOn the price

WMA

Weighted moving average

An average with straight-line weights: the newest bar counts N times, the oldest once.

Main settings
  • Length (20)
  • Source

On the chart: A violet line on the price.

Trend & averagesOn the price

VWAP

Volume-weighted average price

The volume-weighted average of each bar's typical price, (high + low + close) / 3, since the anchor: the trading day by default, or the New York open, the London open or the week. It starts again at every anchor, and the line breaks there rather than joining two days.

Main settings
  • Anchor: trading day, New York open, London open or week
  • Show bands (off)
  • Inner and outer band, in standard deviations (1 and 2)

On the chart: An amber line on the price. Needs volume.

Trend & averagesOn the price

VWAP bands

VWAP with standard-deviation bands

The same VWAP with its two bands switched on: an inner and an outer pair a set number of standard deviations either side.

Main settings
  • Anchor: trading day, New York open, London open or week
  • Inner band (1 std dev)
  • Outer band (2 std devs)

On the chart: The amber VWAP between two pairs of paler bands. Needs volume.

Trend & averagesOwn panelBOTLAB block

Trend read

EMA stack vote and trend filter

Two readings on every closed bar. Stack: +1 when the fast EMA is above the slow one and the close is above the slow one, −1 for the mirror, 0 when they disagree. Filter: up while the close is above the filter EMA, down below it. It describes closed bars; it does not forecast.

Main settings
  • Stack fast EMA (21)
  • Stack slow EMA (55)
  • Filter EMA (50)

On the chart: A +1 / 0 / −1 histogram with a stepped filter line, in its own panel.

Volatility & channelsOn the price

Bollinger Bands

Bollinger Bands

An SMA with a band a set number of standard deviations above and below it. The bands spread when the bars swing harder and pinch when the market goes quiet.

Main settings
  • Length (20)
  • Standard deviations (2)
  • Source

On the chart: An orange middle line between two blue bands.

Volatility & channelsOn the price

Keltner Channels

Keltner Channels

An EMA with a band a multiple of the average true range above and below it.

Main settings
  • EMA length (20)
  • ATR multiple (2)
  • ATR length (10)

On the chart: A blue middle line between two violet bands.

Volatility & channelsOn the price

Donchian Channels

Donchian Channels

The highest high and the lowest low of the last N bars, and the midpoint between them.

Main settings
  • Length (20)

On the chart: Stepped blue edges that move only when a new high or low is made, with an orange midline.

Volatility & channelsOwn panelBOTLAB block

ATR

Average true range

Wilder's average true range, in points: how far a bar typically travels, gaps included.

Main settings
  • Length (14)

On the chart: A pink line in its own panel.

MomentumOwn panel

RSI

Relative strength index

Wilder's RSI: average gains against average losses over N bars, on a scale of 0 to 100.

Main settings
  • Length (14)
  • Source

On the chart: A violet line in its own panel, with the 0, 50 and 100 levels marked.

MomentumOwn panel

MACD

Moving average convergence divergence

The fast EMA minus the slow EMA (the MACD line), an EMA of that line, and the gap between the two as a histogram.

Main settings
  • Fast length (12)
  • Slow length (26)
  • Length of the second EMA (9)
  • Source

On the chart: Two lines over a two-color histogram, in its own panel.

MomentumOwn panel

Stochastic

Stochastic oscillator

Where the close sits inside the last N bars' range (%K), and an average of it (%D).

Main settings
  • %K length (14)
  • %K smoothing (3)
  • %D smoothing (3)

On the chart: A blue %K and an orange %D, 0 to 100, in its own panel.

MomentumOwn panel

ADX / DI

Average directional index with +DI and −DI

Wilder's +DI and −DI say which side is pushing; ADX says how hard, whichever side it is. Above 25 is commonly read as a trending market.

Main settings
  • DI length (14)
  • ADX smoothing (14)

On the chart: Three lines in one panel: ADX, +DI and −DI.

MomentumOwn panel

CCI

Commodity channel index

How far the price is from its N-bar average, measured in mean deviations and scaled by the usual constant 0.015. It reads the typical price by default.

Main settings
  • Length (20)
  • Source (typical price)

On the chart: A blue line swinging either side of zero, in its own panel.

MomentumOwn panel

BOP

Balance of power

(close − open) / (high − low): which side won the bar, from −1 to +1, optionally averaged.

Main settings
  • Smoothing, SMA (1 = none)

On the chart: A histogram either side of zero, in its own panel; shown here averaged over 5 bars.

VolumeOwn panel

Volume

Volume

Contracts traded on each bar, colored by the bar's direction, with an optional average line.

Main settings
  • Show average (on)
  • Average length (20)

On the chart: Bars under the chart in the candle colors, with an amber average.

VolumeOwn panel

Volume MA

Volume moving average

The simple average of volume over the last N bars, on its own, to set beside the volume bars.

Main settings
  • Length (20)

On the chart: An amber line in its own panel; shown here under the volume bars.

VolumeOwn panel

OBV

On-balance volume

A running total: the bar's volume is added on an up close and subtracted on a down close.

Main settings
  • No settings

On the chart: A blue line in its own panel.

VolumeOwn panel

CMF

Chaikin money flow

Each bar's volume weighted by where it closed in its range, added up over N bars and divided by the total volume: from −1 to +1.

Main settings
  • Length (20)

On the chart: A cyan line either side of zero, in its own panel. Needs volume.

Levels & sessionsOn the priceBOTLAB block

Opening range

Opening range, per session, with profile levels

The high and low of the first 5, 15 or 30 minutes of a session (Sydney, Tokyo, Hong Kong, Singapore, Frankfurt, London, New York, the CME evening open, or any time and time zone you set), drawn again on every day on the chart. The range can be the plain high and low or the value area of that window's own volume profile, with its POC, range extensions and the vertical session-open lines. It changes how the chart looks and nothing else.

Main settings
  • Session and windows (5, 15, 30 minutes, one or several)
  • Range basis: high/low or value area
  • Extensions (1x, 1.5x, 2x)
  • Earlier days to keep drawing (5)
  • Shading, line styles, labels and price-scale tags
  • Optional markers where price crosses the range edges, by rules you choose

On the chart: Colored lines per window with tags on the price scale, an optional shaded range and dashed open lines; shown here with the New York 15 and 30 minute windows.

Levels & sessionsOn the price

Prior day H/L/C

Prior trading day high, low and close

The previous CME trading day's high, low and close (18:00 to 17:00 New York), drawn across the current day. The first day on the chart has no prior day, so it shows nothing there.

Main settings
  • Show close (on)

On the chart: Green high, red low and a gray close, held flat across the day.

Levels & sessionsOn the price

Overnight high/low

Overnight (Globex) high and low

The high and low from 18:00 to 09:30 New York, built as the night trades, then held for the rest of the day.

Main settings
  • Hold after 09:30 (on)

On the chart: A sky-blue high and a violet low that step outward overnight and then stay put.

Levels & sessionsOn the price

Session VWAP

VWAP anchored at a session open

The volume-weighted average price from the London or New York open, for as many minutes as you set, with optional bands either side.

Main settings
  • Session (London or New York)
  • Run for (1,440 minutes)
  • Show bands (off)
  • Band width (1 std dev)

On the chart: An amber line starting at the open; shown here from New York with its bands. Needs volume.

Levels & sessionsOn the price

Volume profile levels

POC, VAH and VAL from the chart's bars

The point of control (the price with the most volume) and the value area high and low for each trading day, worked out from the chart's own bars: each bar's volume is spread evenly over the price rows it covered.

Main settings
  • Levels: prior day, or today as it develops
  • Row size (4 ticks)
  • Value area (70%)

On the chart: An amber POC between a pale-blue VAH and VAL, with tags on the price scale.

Order flowOn the price

Big trades

Large prints, as bubbles at the traded price

A marker at the price of each large print, on the bar that holds it. Its size carries the number of contracts; its color says whether a buyer lifted the offer or a seller hit the bid.

Main settings
  • Smallest print, per instrument (NQ 40, MNQ 100, ES 40 …)
  • Or automatic, by standard deviation (2.5)
  • Marker shape, size range and labels
  • Glow (0 to 30 px), colors, outline and optional zones

On the chart: Numbered, glowing bubbles on the candles: mint for the offer lifted, violet for the bid hit. Shown here with the smallest print set to 40 contracts and the glow at its fullest (30 px).

Order flowOn the price

Absorption

Big prints that did not move the bar

A ring where a large print traded at a bar's extreme and the bar then closed away from it: sellers absorbed at the low, or buyers absorbed at the high. It describes the bar that happened, not what comes next.

Main settings
  • Smallest print, per instrument
  • Extreme zone (18% of the bar's range)
  • Close away by (50% of the range)
  • Colors

On the chart: Rings at the bar's high or low.

Order flowOwn panel

DOM imbalance

Resting size, bid against ask

How the resting orders near the price lean at the end of each bar: above zero when more size rests on the bid within the chosen distance, below when the ask side is heavier. Read from this computer's recording of the order book.

Main settings
  • Distance from the price (5, 10, 20 or 50 ticks)

On the chart: A histogram either side of zero, in its own panel. Needs Level 2 depth.

Order flowOn the price

Depth ladder

Resting size at each price near the inside

The order book at the right edge of the chart: a bar for the resting size at each price, bids below the inside and asks above. Live only: it shows the book as it is now.

Main settings
  • Levels each side (15)
  • Reach (60 ticks)
  • Bar length: relative or fixed
  • Widest bar (120 px)
  • Write the sizes
  • Colors

On the chart: Horizontal bars at the right edge, bids and asks in two colors. Needs Level 2 depth.

Order flowOn the price

Book events

Absorbed, pulled and refilled size in the book

What the order book did, marked at its price: a ring where resting size was traded through, a diamond where a large resting size disappeared with almost nothing traded there (pulled), a square where the same price was traded through and came back again (refilled). Live only.

Main settings
  • Absorbed, Pulled, Refilled (each on or off)
  • Pulled size of at least (40 contracts)
  • Colors

On the chart: Small rings, diamonds and squares at the prices where they happened. Needs Level 2 depth.

Order flowOwn panel

Volume delta

Ask volume minus bid volume, per bar

For each bar, the volume that traded at the ask (buyers lifting) minus the volume that traded at the bid (sellers hitting). A bar this computer recorded only in part is drawn faint and marked partial.

Main settings
  • No settings

On the chart: A histogram either side of zero, in its own panel.

Order flowOwn panel

Cumulative delta

Cumulative volume delta

The running total of volume delta, restarted at each CME trading day (18:00 New York) or never. It starts at the first bar this computer recorded.

Main settings
  • Restart: each day or never

On the chart: An amber line in its own panel.

About order flow. The order-flow indicators read the trades and the order book your own Rithmic login delivers to this computer. Per-price volume exists only for the time ORBIT was recording (plus a short tick backfill), and the depth studies need Level 2 depth in your data subscription. Each one says on the chart what it is reading, and why when it has nothing to draw. Indicators describe what already traded; none of them tells you what happens next.

All of it, on every chart.

Launch pricing is $79/month until November 30, 2026, locked for as long as the subscription runs.

Get ORBIT