
Big trades on the chart: what large prints tell you, and what they do not
A big trades indicator marks the unusually large trades on your chart, at the price they traded and colored by who was the aggressor. Here is how it decides what counts as big, the reads traders use, and the mistakes that make large prints look smarter than they are.
What is a big trades indicator?
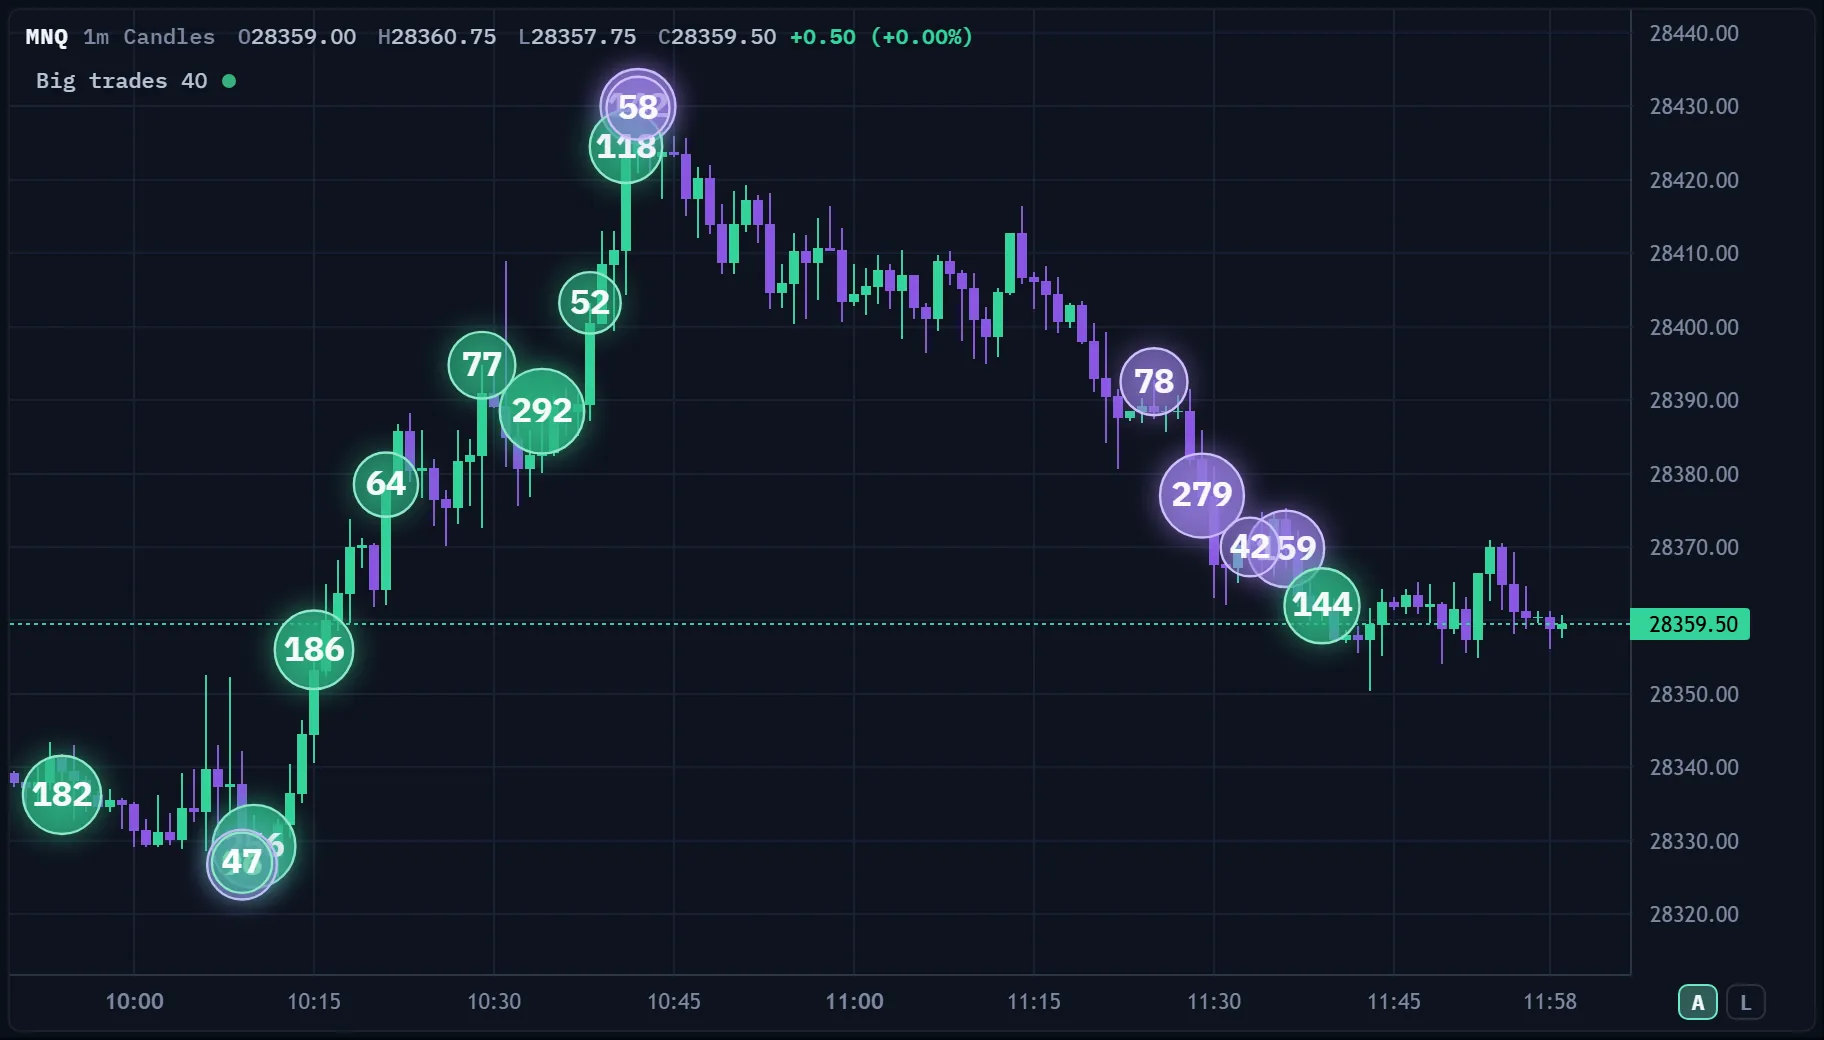
A big trades indicator draws a marker, usually a bubble, at the price of every trade at or above a size you choose. The bubble's size grows with the number of contracts, and its color tells you the aggressor: a buyer who lifted the offer or a seller who hit the bid. Instead of reading every line of time and sales, you see at a glance where the large market orders landed on the chart.
It is a view of the tape, not of the order book. A big print is a market order that met resting orders. It tells you someone was willing to pay the spread in size, at that price, at that moment.
How "big" is decided: fixed size or standard deviation
There are two common ways to filter prints:
- A fixed size per instrument. You pick a contract count that is unusual for that market. A size that is large on NQ is ordinary on MNQ, and ES trades in bigger clips than NQ, so the number must be set per instrument.
- Automatic, by standard deviation. The indicator reads the prints on the chart and marks anything well above the usual size for that stretch of tape, for example 2.5 standard deviations over the average. It adapts to a quiet overnight session and a busy open without you changing anything.
Start with the automatic mode to learn what is unusual for your market, then set a fixed size once you know.
Whichever filter you use, keep a lower bound that is meaningful. Setting it too low turns the chart into confetti; setting it too high hides the very prints you wanted to see.
Four ways traders read big trades
- At a level you marked. Large buying at the prior day's low or a value area edge says someone defended it. The same print in the middle of nowhere means much less.
- With no progress. Large sellers hit the bid again and again and price will not go lower: that is absorption. The order flow indicator guide covers it in detail.
- Exhaustion. Heavy buying on the first legs of a rally and almost none at the last highs suggests the buyers are spent.
- Trapped traders. Big buying above a breakout level, then price falls back below it: those buyers are now under water, and their exits can add to the move down.
Common mistakes with large prints
- Treating a big buy as bullish on its own. Every trade has a buyer and a seller. A big buy may be a short covering, or meet an even bigger seller. Read what price does after it.
- One threshold for every market. A fixed size copied from NQ to MES will mark everything or nothing.
- Ignoring split orders. Large players often split orders into many small ones; a big trades filter will not see those. Delta and the book help fill the gap.
- Forgetting the book. The print shows the aggressor; the depth of market shows who was waiting for them.
Big Trades in ORBIT
ORBIT's Big Trades indicator draws numbered, glowing bubbles on the candles, read from your own Rithmic tape. Prints of five contracts and up are recorded one by one. You set the smallest size per instrument, or switch to automatic mode by standard deviation (2.5 by default), and choose the marker shape, size range, labels, glow and colors; optional zones leave a band at the price of a big print. On the heatmap, the Large trades marker alerts you each time a print over your size lands. The Absorption indicator rings the big prints that did not move the bar.
Every indicator describes what already traded; none tells you what happens next. Practice the reads on paper with the futures trading simulator first, and see the rest of the set on the order flow trading page.
Frequently asked questions
What is a big trades indicator?
A chart indicator that marks each trade at or above a chosen size at the price it traded, sized by contracts and colored by aggressor: buyers lifting the offer or sellers hitting the bid.
What size counts as a big trade on NQ?
There is no fixed answer; it depends on the session and the contract. Start with an automatic filter by standard deviation, see what is unusual, then set a fixed size per instrument.
Do big trades show institutional orders?
They show large market orders. Large players often split orders into smaller pieces, so a big trades filter shows only part of their activity, and it cannot tell you who placed the order.
Is a big buy trade bullish?
Not on its own. Every trade has a buyer and a seller. Read it at a level you marked and watch what price does next; large buying with no progress can mean absorption by sellers.
Does ORBIT have a big trades indicator?
Yes. Big Trades draws bubbles on the candles from your own Rithmic tape, with a fixed size per instrument or an automatic filter by standard deviation.
This is education, not financial advice or a recommendation to trade. Examples are illustrations, not results; futures trading involves substantial risk of loss and is not suitable for all investors.