
Order flow indicators, one by one: what each reads, and how absorption trading works
An order flow indicator reads the trades and the order book instead of only price. Here are the ones futures traders use, grouped by what they read, then a closer look at absorption, the read many order flow traders build around.
What is an order flow indicator?
An order flow indicator is a chart study built from the trades (the tape) or the resting orders (the order book), rather than from open, high, low and close alone. Price shows where the market went; order flow indicators show who pushed it there and who was waiting. They fall into three groups: indicators of the tape, of the book, and of the two meeting at a price.
Indicators that read the tape
- Big trades. Bubbles at the price of each unusually large print, colored by aggressor. See the big trades indicator guide.
- Volume delta. Each bar's volume at the offer minus volume at the bid.
- Cumulative delta. The running total of delta through the session, used for confirmation and delta divergence.
- Pace of tape. Contracts traded per second; a sudden rise often comes with news or a run of stops.
- Footprint. Each bar split by price into volume at the bid and at the offer, with stacked imbalances marked.
- Volume profile. Volume traded at each price over a session, with the point of control and value area.
Indicators that read the order book
- Depth ladder. The resting size at each price near the market. See DOM trading.
- DOM imbalance. How resting orders lean, bid against ask, within a distance of the price.
- Liquidity heatmap. The book painted over time, so resting size and pulled size are visible as bands.
- Book events. Size traded through, size pulled with nothing traded, and size that refilled; refills are how iceberg orders show up.
Absorption trading: aggression that does not move price
Absorption is when heavy aggressive orders trade into a price and that price does not give way: a large resting buyer soaks up the sellers, or a resting seller soaks up the buyers. On a chart it looks like big sell prints at a bar's low while the bar closes well off that low, or a falling cumulative delta while price will not go lower.
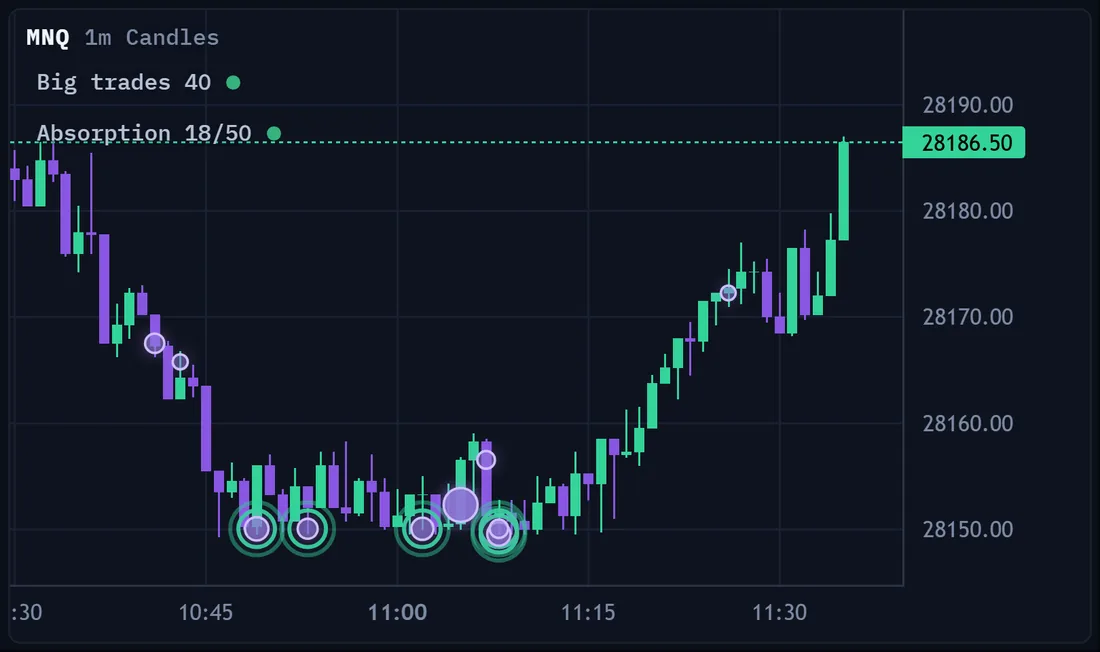
Absorption trading is planning a trade around that read. A typical plan, described here as education only:
- Mark the level first. Absorption at a level you chose before the session (the prior day's low, a value area edge, the overnight high) means much more than absorption anywhere.
- See the aggression. Large prints or strongly negative delta into the level.
- See the hold. Price does not trade more than a tick or two through the level and the bar closes away from it.
- Define the risk. The trade idea is wrong if price trades clearly through the level, so the stop goes beyond it, sized so the loss fits your daily limit.
The failure case matters as much: absorption that finally breaks often leads to a fast move through the level, as the traders who leaned on it exit. That is one reason a fixed stop beyond the level is part of the plan.
Mistakes with order flow indicators
- Stacking every indicator at once. Pick two or three that answer your question at your levels.
- Reading them as forecasts. They describe what already traded and what the book did.
- Missing data. Per-price volume and depth need a recording of the tape and Level 2; a chart loaded after the fact may only have bars.
Order flow indicators in ORBIT
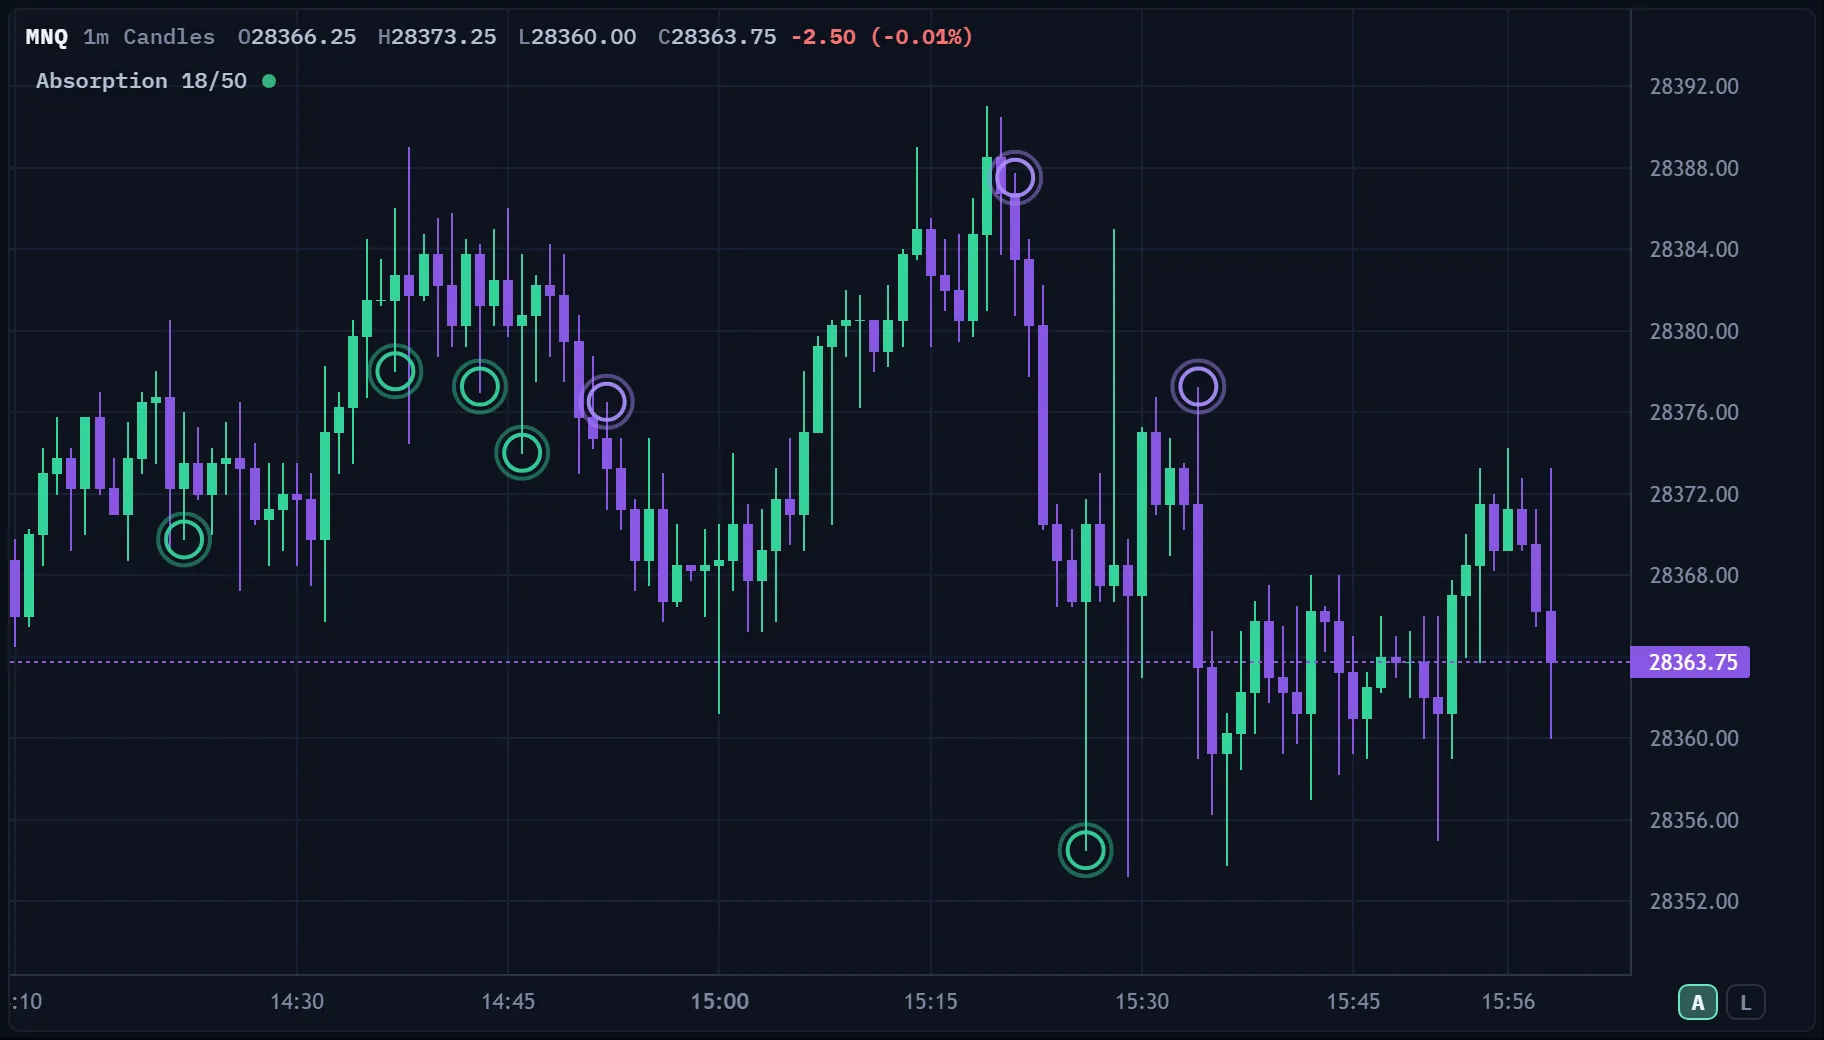
ORBIT's indicator library includes the chart set: Big trades, Absorption (a ring where a large print traded at the bar's extreme and the bar closed away from it), DOM imbalance, Depth ladder, Book events, Volume delta, Cumulative delta and volume profile levels. The heatmap adds its own markers: absorption that also tests whether the level held afterwards, sweeps and stop runs, icebergs and hidden size, large trades, pace of tape, imbalance alerts, delta bars and a footprint. All of it is read from your own Rithmic data on your own computer.
If you write your own strategy in BOTLAB with your own AI key, these reads are the kind of rules you can test on recorded data and run on paper. Once armed on your own Rithmic account, ORBIT trades your strategy inside your account's limits; the strategy is yours. More guides are on the order flow trading page.
Frequently asked questions
What is an order flow indicator?
A chart study built from the trades or the order book rather than price bars alone, such as big trades, delta, cumulative delta, depth, DOM imbalance and a liquidity heatmap.
What is absorption in trading?
Heavy aggressive orders trade into a price and the price does not give way, because a large resting order on the other side soaks them up.
How do you trade absorption?
Traders mark a level first, look for heavy aggression into it with no progress, and plan a trade with a stop beyond the level. It is a read to test on paper, not a rule that works every time.
Which order flow indicator should a beginner learn first?
Start with the order book and the tape: a depth view, big trades and delta. Add cumulative delta and absorption once those make sense at your levels.
Do order flow indicators need Level 2 data?
Book indicators such as the depth ladder, DOM imbalance and the heatmap need Level 2 depth. Tape indicators such as big trades and delta need the trades with their aggressor side.
This is education, not financial advice or a recommendation to trade. Examples are illustrations, not results; futures trading involves substantial risk of loss and is not suitable for all investors.