
Depth of market, explained: how to read the order book that sits under price
The depth of market (DOM) shows the limit orders waiting to buy and sell at each price near the market. Here is how to read it, what DOM traders watch for, its blind spots, and how to see the same book over time instead of only as a snapshot.
What is depth of market (DOM)?
Depth of market, or the DOM, is the list of resting limit orders at each price above and below the current market: the bids (orders to buy) below and the offers or asks (orders to sell) above. It is also called Level 2 data or the order book. Most DOMs show it as a vertical price ladder, with the size waiting at each price beside it and the last trades marked as they happen. DOM trading means making decisions, and often placing orders, from that ladder.
How to read a DOM, step by step
- Find the inside market. The best bid and best offer are the two prices closest to each other. The gap between them is the spread; on NQ and ES it is usually one tick.
- Read the size on each side. Large numbers on the bids below the market are buyers waiting; large numbers on the offers above are sellers waiting.
- Watch what changes. A static ladder tells you little. The information is in what is added, what is pulled and what is traded through.
- Match it with the tape. When market orders hit a price, does the resting size there shrink and give way, or does it hold and refill?
What DOM traders look for
- Imbalance. Much more size resting on one side near the price. It describes the book now; it does not say which way price will go.
- Large resting orders. A price with unusual size can attract price, slow it, or vanish as price approaches.
- Absorption. Aggressive orders keep trading into a level and it does not give way.
- Refills and pulls. Size that keeps coming back can be an iceberg order; size that disappears before it is tested was never certain to trade.
- Thin books. Before a scheduled news release the book often thins out and the spread can widen, so a market order moves price further than usual.
None of these patterns is a trade by itself. DOM traders combine them with a level they marked in advance and with what the tape is doing, and they keep their stop where the idea is clearly wrong.
The blind spots of a DOM
A ladder is a snapshot. It moves many times a second, it shows only the levels near the price, and it forgets what was there a minute ago. That makes two things hard: seeing where large size has been sitting for the last hour, and noticing a pattern of orders appearing and disappearing. It also hides split and hidden orders: the size you see is only the size someone chose to show.
A liquidity heatmap solves the memory problem by painting the same book over time, so resting size becomes bands you can follow, and pulled size becomes a band that ends. Many traders read a ladder and a heatmap together.
Depth of market in ORBIT
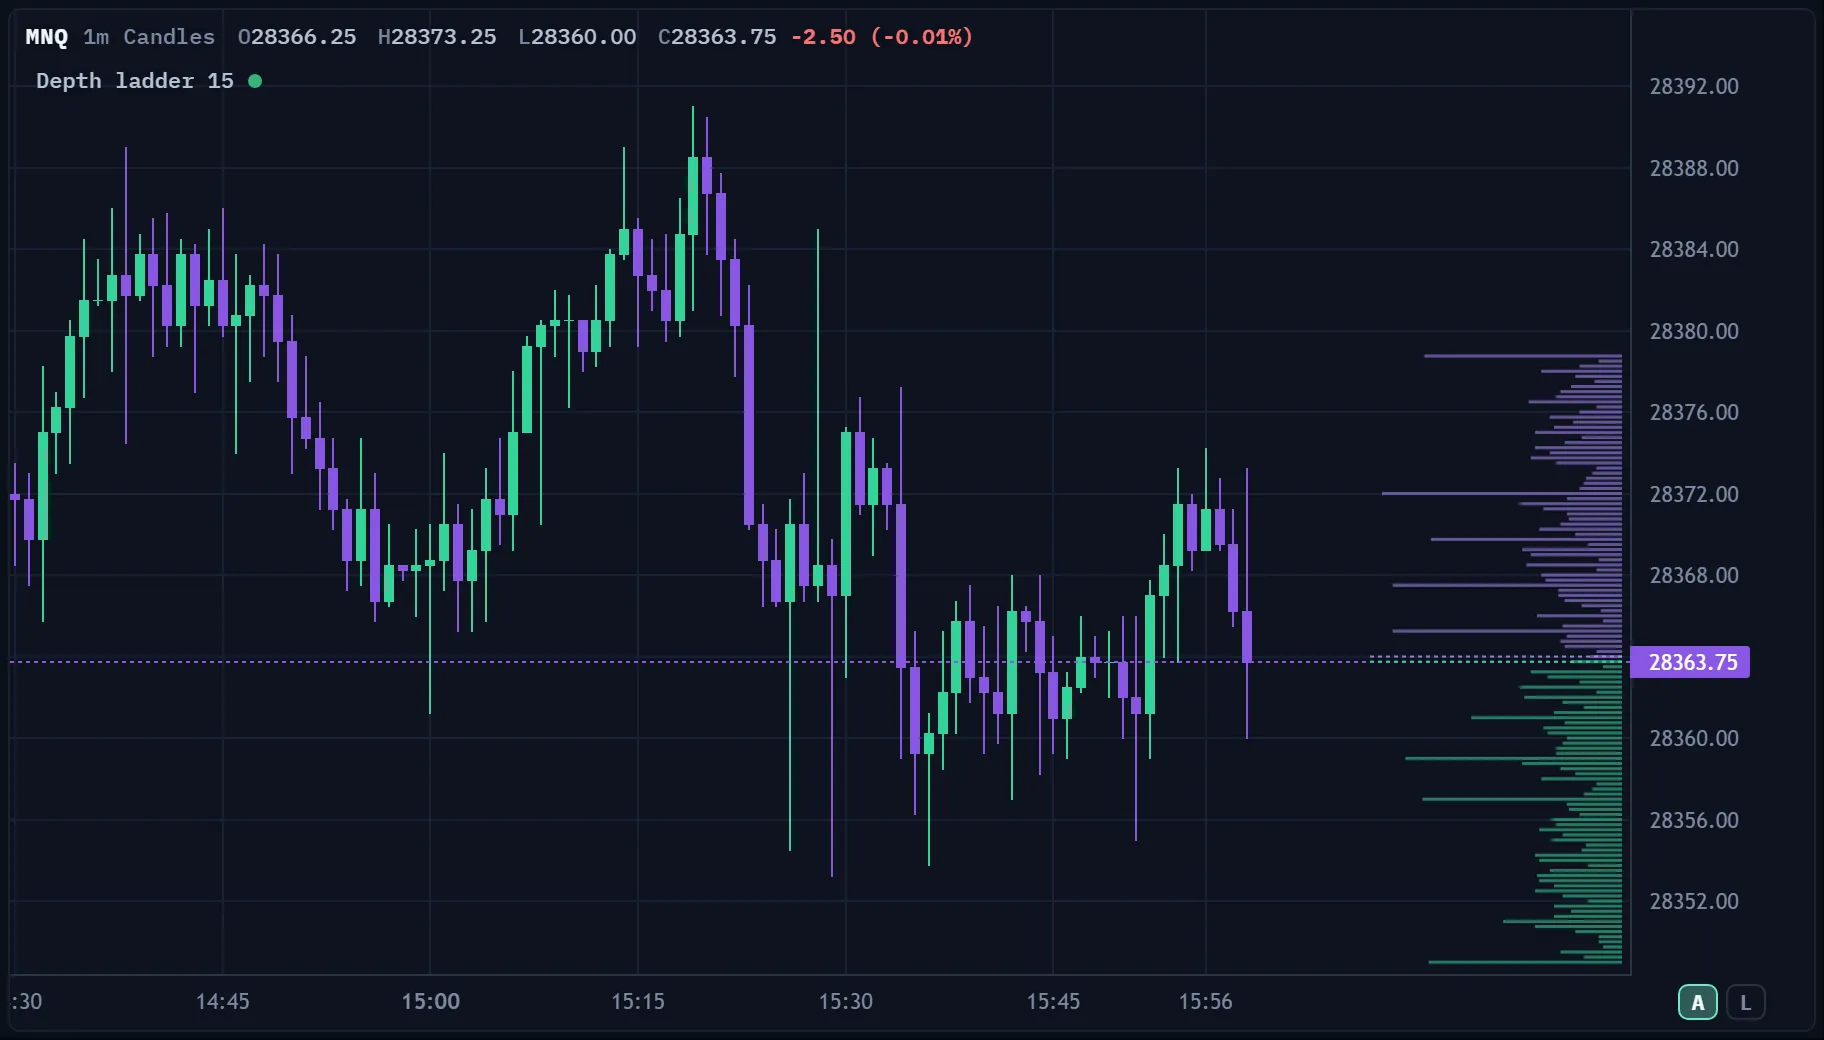
ORBIT reads Level 2 depth from your own Rithmic login and shows it three ways. On the charts, the Depth ladder draws the resting size at each price near the inside at the right edge of the chart (15 levels a side by default), and DOM imbalance plots how the resting orders lean, bid against ask, at the end of each bar, within 5, 10, 20 or 50 ticks of the price. On the heatmap, the price ladder sits beside a column rack: the current order book, cumulative depth, volume, quotes delta (size added or pulled) and time and sales, over the book painted through time.
Orders are placed right on the heatmap with TARGET LOCK: left-click for a buy, right-click for a sell, on every account you selected. On any chart you can also right-click a price for a quick order. Each account keeps its own risk rails. Depth studies need Level 2 in your Rithmic data subscription; see the Rithmic setup guide.
Frequently asked questions
What is DOM in trading?
DOM stands for depth of market: the resting limit orders to buy and sell at each price near the current market, usually shown as a price ladder. It is also called Level 2 or the order book.
How do you read depth of market?
Find the best bid and offer, read the size waiting on each side, then watch what is added, pulled and traded through, and how it matches the trades on the tape.
What is the difference between a DOM and a heatmap?
A DOM shows the book as it is right now. A liquidity heatmap paints the same book over time, so you can see where size has rested and where it was pulled.
Is DOM imbalance a buy or sell indicator?
No. It describes how resting orders lean at that moment. Orders can be pulled before price reaches them, so read it with the tape and your levels.
Do I need Level 2 data to read the DOM?
Yes. Depth of market needs Level 2 depth in your market data subscription; top-of-book data shows only the best bid and offer.
This is education, not financial advice or a recommendation to trade. Examples are illustrations, not results; futures trading involves substantial risk of loss and is not suitable for all investors.