
MACD crossovers at the open: every cross on MNQ futures, and what each one showed
MACD (12, 26, 9) on the one-minute micro Nasdaq futures chart, cross by cross through the New York open: what the lines and bars are, when a cross counts, and what happened next.
Watch it on the ORBIT YouTube channel → The video goes live on Wednesday, November 18 at 4:00 PM CT.
MACD in one paragraph
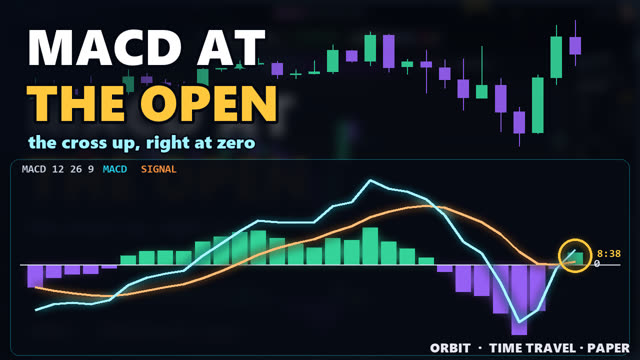
The blue line is the gap between a fast (12) and a slow (26) average of price. The orange line is a 9-bar average of the blue one. The bars are the distance between the two lines: green above zero, violet below. A cross counts when the bar closes, not while it is still forming.
Every cross at the open (MNQ, Friday 6 November 2026)
- 8:31 CT: the first cross down after the open. Price fell about a hundred points, to 27,035 at 8:35.
- 8:37 CT: the bars shrank to zero inside the bar, and the bar closed just under it: no cross yet.
- 8:38 CT: the cross up, right at zero, on the close at 27,180. Of every MACD cross on this recorded day, this one had the longest run after it.
- 8:53 CT: the high, 27,425, with shorter green bars than at 8:46.
- 8:55 CT: the cross down, far above zero, at 27,317. By 9:08 price came down more than a hundred points, to 27,203.
- 9:15 to 9:26 CT: eight crosses in twelve minutes, with both lines tangled around zero while price moved sideways.
An example from the 8:38 cross
The video draws an example long from that close: entry 27,180, stop 27,131 under the bar that started the turn, target 27,277 at twice the risk. It reached its target at 8:40 on this recorded session. Use a cross as additional confluence for your own decision, never on its own: the 9:15 stretch shows how many crosses a sideways market makes.
How to read it
Where the cross happens matters as much as the cross: right at zero at 8:38, far above zero at 8:55, tangled around zero at 9:15. The bar height tells you whether the gap between the averages is growing or shrinking right now. For day trading futures, practice reading all three kinds in TIME TRAVEL before you lean on any of them.
Practice it with TIME TRAVEL
Everything in the video was recorded in TIME TRAVEL, a feature of ORBIT: go back to a recorded session, here Friday 6 November 2026 on MNQ, and play it tick by tick from the real recorded tape and order book on a paper (simulated) desk. Hone your skills by going back in time and practicing your setups, as often as you like. Read more in the futures trading simulator guide.
Join the ORBIT Discord
Launch price: sign up before November 30 and keep ORBIT at $79 a month for life, for as long as you stay subscribed. After November 30 the price is $149 a month. Get ORBIT
Love ORBIT? Share it and grow a recurring monthly income with our affiliate program. To express interest, email our founder directly: amlan@tradeonorbit.com
More tutorials like this one are on the ORBIT YouTube channel.
Get ORBIT
The HEATMAP, the desk charts with their indicators, TIME TRAVEL and the paper desk come in one subscription, on your own Rithmic login. Get ORBIT here.
Everything shown was recorded on a paper (simulated) desk in a TIME TRAVEL session of recorded market data; simulated results do not reflect real fills, slippage or commissions. MACD describes what price has already done; it does not forecast the next move. This post is education only, not financial advice. Futures trading involves substantial risk of loss and is not suitable for every investor.
Frequently asked questions
When does a MACD cross count?
When the bar closes. In the video the 8:37 bar's histogram touched zero inside the bar but closed just under it, so the cross came on the 8:38 close.
What MACD settings does the video use?
MACD 12, 26, 9 on the one-minute MNQ chart: a 12 and a 26 average for the blue line and a 9-bar average of it for the orange line.
Why were there eight crosses between 9:15 and 9:26?
Price moved sideways, so the fast and slow averages stayed close together and the two lines tangled around zero, crossing again and again.