
Stop runs and liquidity sweeps: four of them at the NQ futures open, on the heatmap
A stop run is a liquidity sweep big enough to leave a shape on the tape. This video turns on the HEATMAP's Sweeps and stop runs indicator at the New York open and stops on every one that mattered.
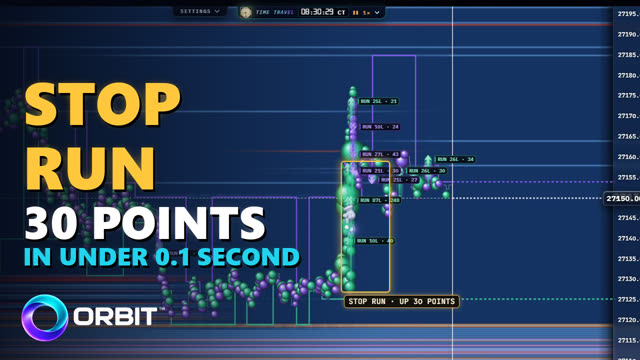
Watch it on the ORBIT YouTube channel → The video goes live on Tuesday, November 17 at 10:00 AM CT.
What a sweep is, and when it is a stop run
A liquidity sweep is one aggressive order filling level after level of the order book. Its prints land within milliseconds, each one at the same price or further on. ORBIT's HEATMAP marks a sweep when one side's prints walk at least four price levels and twenty lots, each print within 60 milliseconds of the last. Through eight levels or more it is a stop run, drawn thicker and glowing: the shape a cascade of resting stops leaves on the tape. For the background, read what is a liquidity sweep.
The New York open, sweep by sweep (NQ futures, MNQ)
- 8:30 CT, the bell: sellers swept straight down the book, more than twelve points in two hundredths of a second. Price bounced back above 27,175, then sank again.
- 8:30:25 CT: buyers swept straight up, from 27,128 to 27,158: thirty points in less than a tenth of a second, hundreds of contracts, almost all of them buys, in one burst.
- 8:35:05 CT: a stop run down to 27,035.75, the low of the drop, and price turned straight back up: fifty points in under nine seconds.
- 8:37 CT, the busiest minute of the day: buyers swept up through 27,200, and sellers answered with twenty points down in a single instant.
Tune it to your market
Open the indicator's settings and every number is yours: how many levels make a sweep, how many make a run, the time between prints, the time for the whole walk and the smallest size. Set forty levels or more and only the longest walks stay on the map. The sweeps sit on the same liquidity heatmap as the book, so you see which resting size each one ran through.
An example on the chart
The video then draws an example long after the 8:35 stop run on the desk chart: entry 27,050, stop 27,030 under the sweep's low, target 27,090 at twice the risk. On this recorded session price reached that target about nine seconds after the low. Use a stop run as one more piece of confluence for your own decision, next to your levels.
Practice it with TIME TRAVEL
Everything in the video was recorded in TIME TRAVEL, a feature of ORBIT: go back to a recorded session, here Friday 6 November 2026 on MNQ, and play it tick by tick from the real recorded tape and order book on a paper (simulated) desk. Hone your skills by going back in time and practicing your setups, as often as you like. Read more in the futures trading simulator guide.
Join the ORBIT Discord
Launch price: sign up before November 30 and keep ORBIT at $79 a month for life, for as long as you stay subscribed. After November 30 the price is $149 a month. Get ORBIT
Love ORBIT? Share it and grow a recurring monthly income with our affiliate program. To express interest, email our founder directly: amlan@tradeonorbit.com
More tutorials like this one are on the ORBIT YouTube channel.
Get ORBIT
The HEATMAP, the desk charts with their indicators, TIME TRAVEL and the paper desk come in one subscription, on your own Rithmic login. Get ORBIT here.
Everything shown was recorded on a paper (simulated) desk in a TIME TRAVEL session of recorded market data; simulated results do not reflect real fills, slippage or commissions. A sweep or a stop run describes orders that already traded; it does not forecast the next move. This post is education only, not financial advice. Futures trading involves substantial risk of loss and is not suitable for every investor.
Frequently asked questions
What is a stop run in futures trading?
A stop run is a sweep that walks through eight price levels or more in milliseconds: one side's aggressive prints, each at the same price or further on, the shape a cascade of resting stop orders leaves on the tape.
How does ORBIT detect a liquidity sweep?
The HEATMAP marks a sweep when one side's prints walk at least four price levels and twenty lots, each print within 60 milliseconds of the last. Every one of those numbers can be changed in the indicator's settings.
Can I practice reading sweeps?
Yes. TIME TRAVEL plays a recorded session tick by tick with the real tape and order book, so you can watch the same sweeps again on a paper desk.