
Volume profile trading: where the volume traded, and what that tells you
A volume profile turns a day of trading sideways: instead of volume over time, it shows volume at each price. Here is what the point of control and the value area are, how volume profile differs from market profile, and how traders use the levels.
What is a volume profile?
A volume profile is a histogram drawn along the price axis. For a chosen period, such as a day or a session, it adds up the volume traded at each price (or each small band of prices, called a row) and draws a bar for it. Long bars are prices where a lot traded; short bars are prices price moved through quickly. It shows where the market spent its volume, which a time chart does not.
The levels traders read
- Point of control (POC). The price with the most volume in the period.
- Value area (VA). The range of prices around the POC where a set share of the volume traded, usually 70%. Its edges are the value area high (VAH) and value area low (VAL).
- High volume nodes (HVN). Prices with heavy volume. Price often slows and rotates there.
- Low volume nodes (LVN). Prices with little volume. Price tends to move through them faster, because little business was done there.
Volume profile vs market profile
They are close cousins and the words are often mixed up. Market profile (TPO, time price opportunity) builds the shape from time: it stacks a letter for each half-hour period that traded at a price, so the widest part of the shape is where price spent the most time. Volume profile builds the shape from volume: the widest part is where the most contracts traded. Time and volume often agree, but not always, and a profile built on volume reads real participation instead of only the clock. Both give you a POC and a value area.
How traders use them
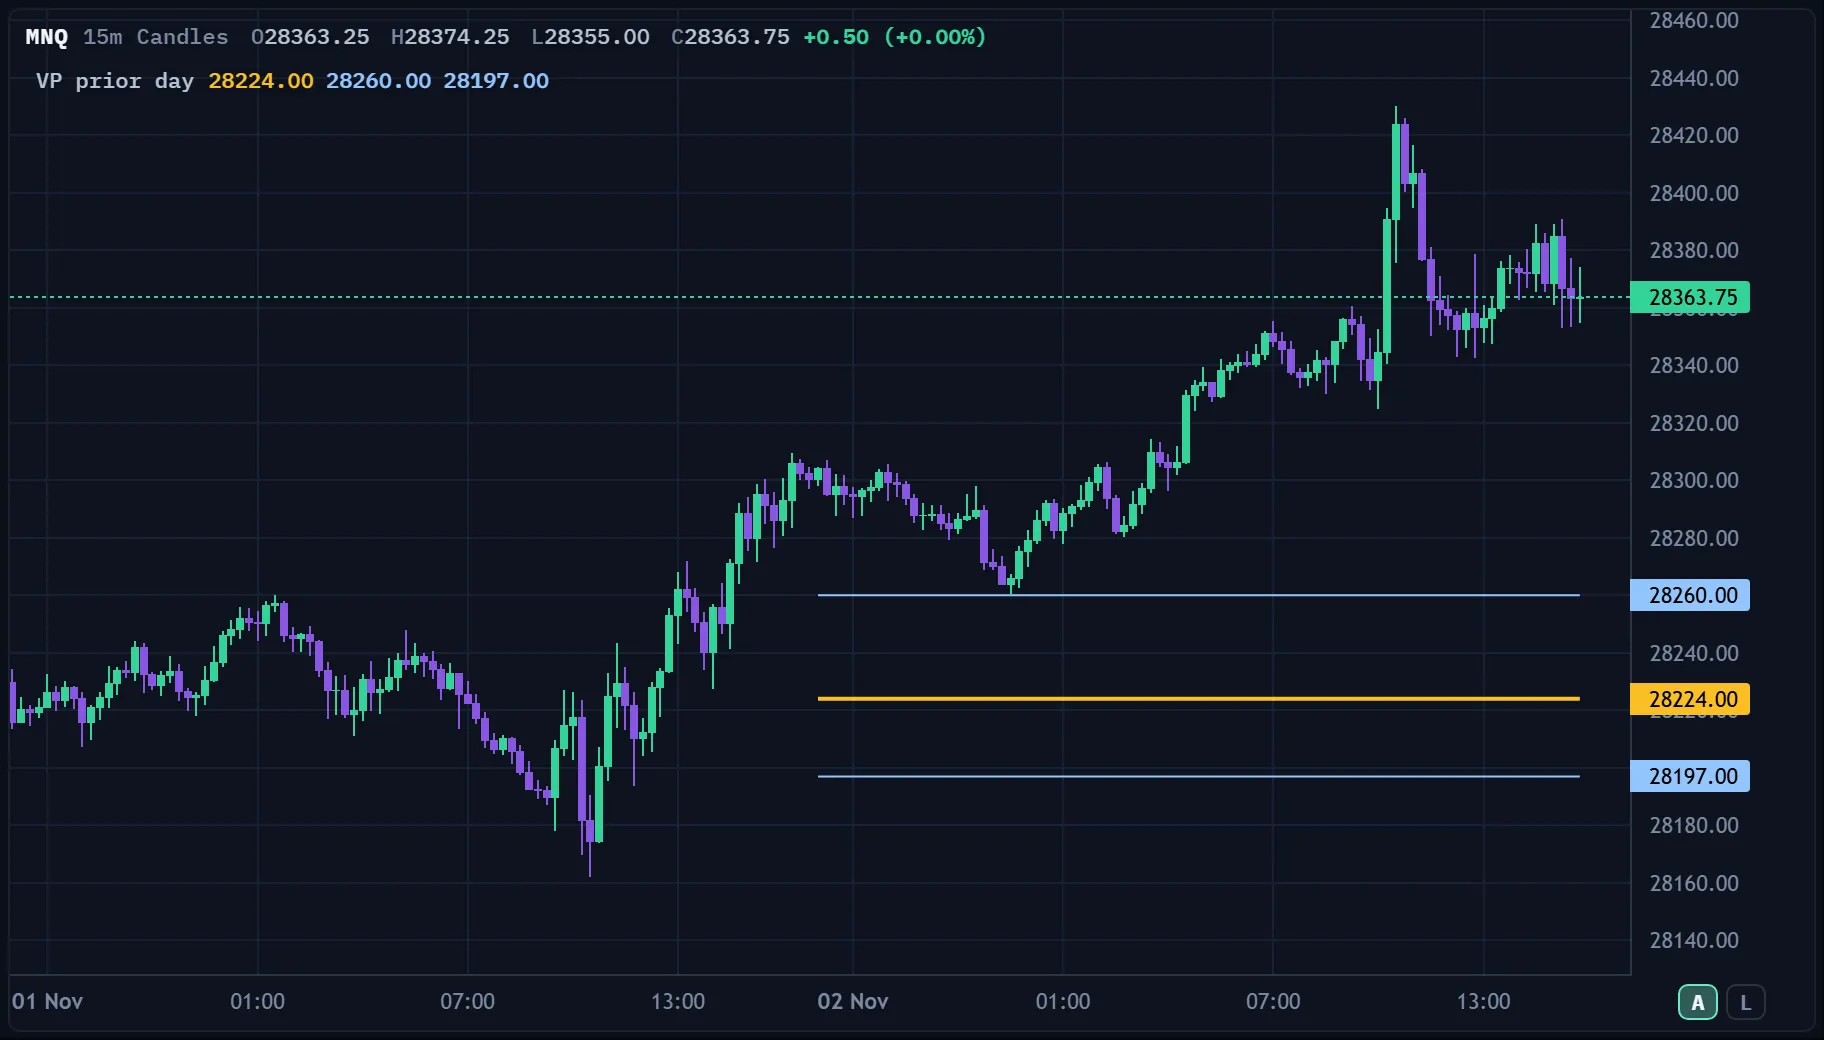
- Mark yesterday's levels. The prior day's POC, VAH and VAL are references many traders carry into the next session, because the market has already shown it did business there.
- Watch the open against yesterday's value. An open inside the prior value area describes a market still rotating; an open outside it describes a market that has moved away. Each is a description to watch, not a trade call.
- Look for acceptance or rejection at the edges. At the VAH or VAL, does price trade and hold beyond it (accepted) or turn back (rejected)?
- Use nodes as map points. An LVN above price can be a place price may travel through quickly; an HVN can be a place it slows. Neither is a promise.
- Combine with order flow. A level means more when the delta, the big trades and the heatmap show what is happening there as price arrives.
The limits
A profile is made of past volume, so every level is a record of what already traded. It does not say what happens next. A profile built from candles has to assume how each bar's volume was spread across the prices it covered, which is an approximation; one built from the tape is exact. Row size and the choice of period change the shape, so two traders can draw two different POCs from the same day.
Volume profile levels in ORBIT
ORBIT's volume profile levels indicator draws the POC, VAH and VAL for each trading day on your chart, worked out from the chart's own bars: each bar's volume is spread evenly over the price rows it covered. You choose the levels (the prior day, or today as it develops), the row size (4 ticks by default) and the value area (70% by default). The opening range indicator can also use the value area of its own window's profile with that window's POC. Because the levels are drawings of past volume, they place no order. For depth over time, the liquidity heatmap shows where resting size has sat, and for the same sessions anchored from a bar you pick, see anchored VWAP.
Frequently asked questions
What is volume profile trading?
Trading with reference to a histogram of volume at each price: the point of control, the value area and the high and low volume nodes.
What is the point of control?
The price with the most volume in the period the profile covers.
What is the value area?
The range of prices around the point of control where a set share of the volume traded, usually 70%, bounded by the value area high and low.
What is the difference between volume profile and market profile?
Market profile (TPO) builds its shape from time spent at each price; volume profile builds it from contracts traded at each price. Both give a POC and a value area.
Does ORBIT draw volume profile levels?
Yes. The volume profile levels indicator draws the POC, VAH and VAL for the prior day or the developing day, with an editable row size and value area.
This is education, not financial advice or a recommendation to trade. Examples are illustrations, not results; futures trading involves substantial risk of loss and is not suitable for all investors.