
Anchored VWAP: where to start it, what the bands mean, and what it cannot do
A VWAP that starts at a bar you choose shows the average price paid since that moment. Here is how anchored VWAP is calculated, where futures traders anchor it, how the bands work, and where it misleads.
What is anchored VWAP?
VWAP is the volume-weighted average price: the average of price over a period, where each price counts in proportion to the volume traded there. Session VWAP restarts every trading day. Anchored VWAP restarts from a bar you pick, such as a swing low, a gap, a news bar or the weekly open, and keeps running to the right. It answers a question a daily VWAP cannot: what is the average price paid, weighted by volume, since that event?
The formula is the running sum of price times volume divided by the running sum of volume. The standard-deviation bands are volume-weighted too: a band is the VWAP plus or minus a chosen number of standard deviations of price around it.
Where traders anchor it
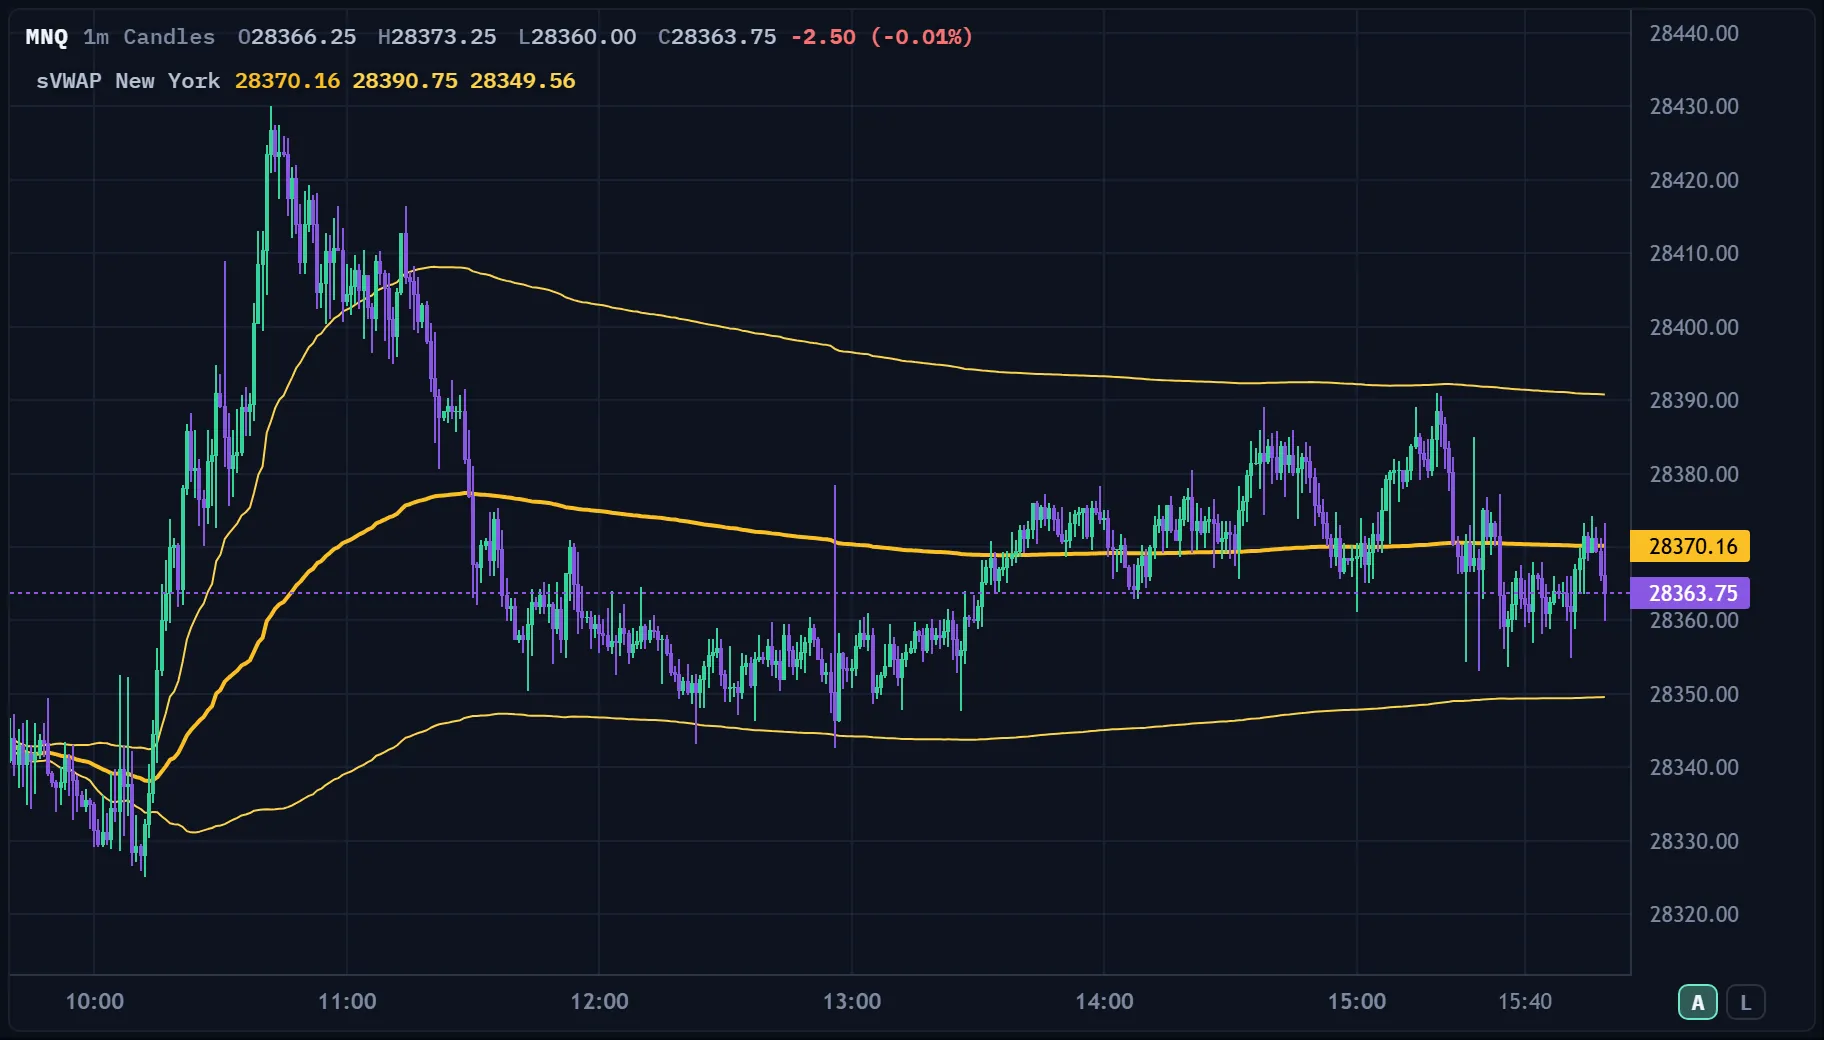
- The session open or the New York open. The most common anchor on NQ and MNQ: the average price paid since the cash market opened (8:30 a.m. CT).
- A swing high or low. The average price since the extreme; traders watch whether pullbacks are bought or sold there.
- A gap or a news bar. The average price since the event, to see whether the move is being accepted.
- The week or the month open. A slower reference that survives the day.
How to read it
- Price above the line means the volume traded since the anchor was, on average, at lower prices than now; below, at higher prices. That is a description of where price sits against the average, not a trade call.
- A touch of the line from above or below is a level other traders are watching. Note whether price is accepted (trades and holds beyond it) or rejected (turns away).
- The bands show how stretched price is from that average, in standard deviations. A move to an outer band is a large move relative to the volume-weighted average; it can reverse or keep going, so read it with what the tape and the order flow are doing.
- Compare two anchors. If price sits between a swing-low VWAP and a session VWAP, that gap is the area that holds the argument.
The limits
VWAP is built from past volume, so it lags. It describes what has traded; it predicts nothing. A VWAP anchored at a different bar is a different line, so two traders can see two different "VWAPs" and both be right. On bar charts the calculation uses one price per bar at that bar's volume, an approximation of a tick-by-tick VWAP. And a VWAP without volume data is only an average of prices; check that your data includes real volume.
Anchored VWAP in ORBIT
- Session VWAP and VWAP. The VWAP indicator anchors at the trading day by default, or at the New York open, the London open or the week. It starts again at every anchor and the line breaks there. VWAP bands add an inner and an outer pair at 1 and 2 standard deviations, both editable.
- The anchored VWAP drawing tool. From the chart's drawing toolbar, click any bar to anchor a VWAP there. It runs to the right and can carry up to three bands each side, in standard deviations or percent, with the price source (close, typical price, OHLC average or midpoint) and the volume basis your choice. Drawings are saved per chart and instrument.
- It draws; it does not trade. A VWAP line in ORBIT is a drawing of past volume-weighted price. It places no order and changes no stop.
For a recorded example of the session VWAP and its bands, read VWAP bands on NQ futures. For the volume-at-price view of the same sessions, see the volume profile guide.
Frequently asked questions
What is anchored VWAP?
A volume-weighted average price that starts at a bar you choose, such as a swing low, a gap or the session open, and keeps running to the right.
What is the difference between VWAP and anchored VWAP?
Session VWAP restarts every trading day. Anchored VWAP restarts from any bar you pick, so it shows the average price paid since a specific event.
Where should I anchor VWAP on NQ futures?
Common anchors are the New York open, a swing high or low, a gap or news bar, and the week open. There is no single right place; the anchor should mark an event you can name.
What do VWAP bands show?
Standard-deviation bands show how far price has moved from the volume-weighted average. They describe how stretched price is, not which way it will go.
Can I draw an anchored VWAP in ORBIT?
Yes. Pick the anchored VWAP tool in the chart's drawing toolbar and click a bar. It supports up to three bands each side in standard deviations or percent.
This is education, not financial advice or a recommendation to trade. Examples are illustrations, not results; futures trading involves substantial risk of loss and is not suitable for all investors.